
Infographics and Data Visualization
Data visualization turns findings into charts and graphics people can read quickly and correctly. Praxia Insights designs visualizations, infographics, and social assets for research reports, annual reports, presentations, and public-facing publications.
Most research reports have too many charts and not enough that work. Every finding gets a graph, a good share of those graphs use the wrong chart type for what they're showing, and the reader stops paying attention long before the end.
A visualization works best when you ask it to do one job. It should make a single point clear the moment somebody looks at it, and if a reader has to study the thing to work out what they're seeing, the chart hasn't done its job no matter how much data you packed into it.
We design visualizations around what each finding needs to communicate and to whom, and that's a different question from what the software will let you make.
Discuss your visualization project

What We Design
Charts for reports
The graphs inside a research report, evaluation report, or white paper, with the right chart type chosen for what each finding is showing and labeled so nobody has to decode it.
Annual report graphics
Outcome and impact visualizations for annual and donor reports, designed for readers who don't work in your data every day and won't spend long on any one page.
Infographics
Single-page graphics that carry one story, for handouts, funder communication, and anywhere the audience won't read a full report.
Presentation graphics
Charts built for a screen instead of a page, so that usually means fewer data points, larger labels, and one point per slide.
Social media stat cards
Individual findings designed for social distribution, since that's how original research reaches people who'd never open the PDF.
Public-facing report design
Full visual design for research meant to be published, including branded layout and the assets that go with it.
Getting the Chart Right
Choosing the chart type is where most visualization goes wrong, and it's a decision people make out of habit instead of asking what the numbers are doing.
Comparisons across categories want bars, and change over time wants a line. Parts of a whole are usually clearer as a stacked bar than as a pie, and once you have more than five categories a pie chart stops communicating anything. Relationships between two variables want a scatterplot, and distributions want something that shows spread instead of collapsing everything to an average
We'll also tell you when a finding shouldn't be a chart at all. A single number is usually better presented as a large number on the page, and three data points can generally be written out in a sentence.
Honest Visualization
Charts are persuasive, and that's what makes it so easy to mislead people with them. A truncated axis will make a small difference look dramatic, and a carefully chosen scale will make a flat trend look like growth, and both of those charts are technically accurate, so there's nothing anybody can point at and call false.
We design so the visual impression matches what your numbers actually say, and in practice that means axes starting at zero where it matters, sample sizes visible on the chart, and uncertainty shown wherever a difference is less solid than the picture would otherwise imply.
It's also self-interested advice. A funder or a journalist who spots a misleading chart stops trusting the entire report, including everything in it that was sound.
Project Examples

A NIH-funded study examining neuropsychological predictors of adaptation after trauma.

A five-year randomized control trial (RCT), funded by the U.S. Department of Ed, to study individualized math instruction.
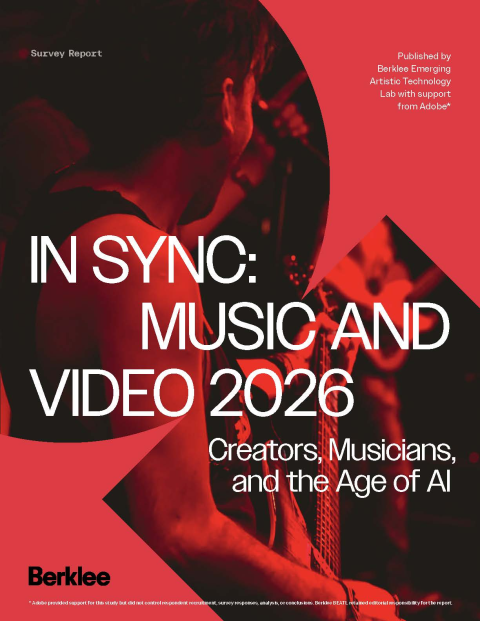
Led a national survey study in partnership with Berklee BEATL & Adobe to study AI use in the music industry.
How We Work
1. Initial consultation and plan
We'll meet to talk through what you need and confirm that this is the right approach for the decision you're facing.
2. Project scoping and budget
You receive a custom scope of work with tasks, due dates, and budget before any work begins. Fixed scope, no hourly surprises.
3. Project execution
You receive updates on progress throughout, including recruitment status and fielding milestones.
4. A true partnership approach
We share insights with you as they come up throughout the project, so your team can start acting on what we learn long before the final report is finished.
5. Project completion
We deliver final insights in the format your team will actually use, whether that's a written report, an executive presentation, or a working session.
Frequently Asked Questions
-
Yes. Send us the data or the report and we'll design the visualizations. We'll also tell you honestly if a finding doesn't have enough behind it to be worth a chart.
-
Far fewer than most reports contain. A chart should earn its place by making a point that prose would take a paragraph to make, and if a finding is really one number, just write the number.
-
It depends on the output. Charts for reports and presentations get built in design tools so they can be styled properly, and interactive or recurring reporting gets built in Power BI, Tableau, Looker Studio, or Excel and Google Sheets, so we'll work in whatever fits how you plan to use it.
-
One to three weeks for a set of report charts. Full infographic design or a branded public-facing report takes longer, usually three to five weeks depending on rounds of revision.
-
It depends on the number of visualizations, whether analysis is included, and how much design work is involved. A set of clean report charts costs the least, and a designed public-facing report with social assets costs the most. We'll give you a fixed-scope quote after an initial consultation.
-
Yes. Send us your brand guidelines and we'll design to them. One caution: some brand palettes don't work well for data, particularly when two brand colors are hard to tell apart or the palette isn't accessible to colorblind readers. We'll flag it and suggest a data palette that stays consistent with your brand.
-
Yes. Stat cards carrying one finding each are how research reaches people who'd never download the report. We've produced branded social assets alongside a public-facing research report, and the same approach works for annual reports and evaluation findings.
-
Usually the axis. Starting a bar chart above zero exaggerates small differences, and choosing a scale that flatters a trend does the same thing more subtly. Missing sample sizes and hidden uncertainty also mislead, since a difference based on twelve responses looks identical to one based on twelve hundred.
-
Yes. We produce full visual design for research meant to be published, including layout, typography, charts, and the social assets that go with it.
-
Yes, and it's worth asking for. We check color contrast, avoid palettes that colorblind readers can't tell apart, label directly on the chart where possible, and make sure the point still comes across in black and white.
Our Experience
More than 60 studies designed, including case study, quasi-experimental, RCT, and mixed-method designs
More than 100 focus groups and in-depth interviews conducted
More than $4 million in grant-funded research managed
Clients spanning Fortune 500 companies, startups, nonprofits, universities, and federally funded programs
Our researchers hold doctorates in educational neuroscience, psychology, and related fields
Need your findings to land visually?
Tell us what you're publishing and who's reading it, and we'll advise on what would work and what it would take.